GDB Advanced Techniques: Expanding GDB Functionality with Custom Function Execution

GDB is the go-to tool for debugging and troubleshooting low-level applications such as C++.
Sometimes all you need simple break at some specific point and print a variable to inspect its value. Other times you need to go even further and loop through some memory structure such as a list.
Defining simple functions in GDB
GDB has support for user-defined functions via the define command.
Here is an example of a simple function:
(gdb) define my_function
Type commands for definition of "my_function".
End with a line saying just "end".
>print $arg0
>end
(gdb) my_function "marcelo"
$1 = "marcelo"
(gdb)
Executing commands at breakpoints
Another functionality of GDB is the ability to automatically execute commands when stopping at a specific breakpoint. This is useful when you are breaking in a point or function that is invoked many times and you have to repeatedly print or execute the same commands over and over again.
(gdb) break function_name
(gdb) commands
Type commands for breakpoint(s) 1, one per line.
End with a line saying just "end".
> [your command 1]
>[your command 2]
>[. . .]
>end
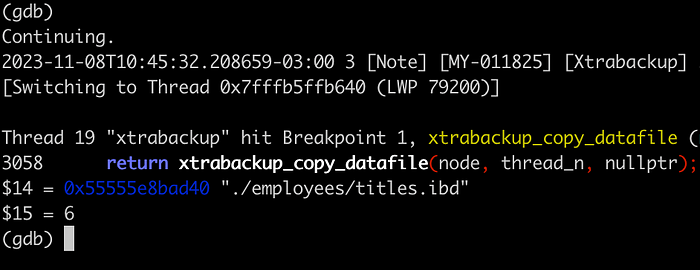
A more detailed example using Percona XtraBackup to print file name and tablespace ID while the files are being copied:
(gdb) b xtrabackup_copy_datafile
Breakpoint 1 at 0x55555af4258a: xtrabackup_copy_datafile. (2 locations)
(gdb) commands
Type commands for breakpoint(s) 1, one per line.
End with a line saying just "end".
>p node->name
>p node->space->id
>end
(gdb) r
(gdb) c
Continuing.
2023-11-08T10:01:05.602230-03:00 1 [Note] [MY-011825] [Xtrabackup] >> log scanned up to (364739678)
[Switching to Thread 0x7fffb7fff640 (LWP 79134)]

Thread 15 "xtrabackup" hit Breakpoint 1, xtrabackup_copy_datafile (node=0x55555e8ba790, thread_n=3, dest_name=0x0) at /work/pxb/src/8.0/storage/innobase/xtrabackup/src/xtrabackup.cc:3062
3062                               const char *dest_name) {
$8 = 0x55555e8ba6a0 "./employees/employees.ibd"
$9 = 2
(gdb) c
Continuing.
2023-11-08T10:07:06.993065-03:00 1 [Note] [MY-011825] [Xtrabackup] >> log scanned up to (364739678)
[Switching to Thread 0x7fffb67fc640 (LWP 79198)]

Thread 18 "xtrabackup" hit Breakpoint 1, xtrabackup_copy_datafile (node=0x55555e8bb440, thread_n=6) at /work/pxb/src/8.0/storage/innobase/xtrabackup/src/xtrabackup.cc:3058
3058   return xtrabackup_copy_datafile(node, thread_n, nullptr);
$10 = 0x55555e8bb350 "./employees/dept_emp.ibd"
$11 = 5
Exploring GDB Python API
There are times when we need to perform more complex tasks under GDB, such as storing return values into variables, creating loops, and so on.
GDB has integration with Python API to allow users to extend GDB even further to their needs.
To demonstrate the API, we will walk through the analysis of https://jira.percona.com/browse/PS-8357 .
In summary, this bug happens when MySQL / Percona XtraBackup is doing a shutdown and there are pages that just got read from the Change Buffer. Where is a snap in the resolution:
Problem:
There is a possibility that at shutdown by the time we do the last
sweep on flushing the buffer pool there are still pages in the flush
list. Those pages are still marked as io_fix->BUF_IO_READ thus they are
not eligible for flushing from flush_list.Where is the workflow:
ibuf_merge_in_background requested those pages to be read in order to
merge the ibuf changes. This will mark the page as BUF_IO_READ and
increment buf_pool->n_pend_reads by 1.When IO threads pick them up, it will start to merge the insert
bugger changes.On the first change, it will add the page to flush_list.
If there are more changes to apply, it will and continue on applying
the changes until it is done.Once the io thread finishes applying ibuf records to this page, it
will mark the page as BUF_IO_NONEthe io thread decreases buf_pool->n_pend_reads by 1.
The last sweep on flushing buffer pool considers the round of flushes
completed when n_flushed == 0 which is not correct, if it runs when we
are at step 4.
In order to reach this conclusion, I had to investigate every single page in each buffer pool instance. This means that I would have to investigate hundreds of thousands of pages. In order to accomplish this the Python API came handy.
The below function does all the heavy lifting work and investigates each page available in the LRU list of buffer pool. Save it on a .py file and source it into GDB to be able to use it as a function:
import os

class printLRUList (gdb.Command):
  """Collect required info for a bug report"""

  def __init__(self):
    super(printLRUList, self).__init__("printlrulist", gdb.COMMAND_USER)

  def invoke(self, arg, from_tty):
    raw_number_of_pages = gdb.execute("p buf_pool_ptr[1]->LRU->count", to_string=True)
    number_of_pages = raw_number_of_pages.split("= ")[1]
    print("Total Pages in LRU: ")
    print(number_of_pages)
    gdb.execute("set $lru_page=buf_pool_ptr[1]->LRU->start", to_string=True)
    io_fix_none = gdb.execute("p $lru_page.io_fix", to_string=True).endswith("BUF_IO_NONE\n")
    if not io_fix_none:
      data = gdb.execute("p $lru_page", to_string=True)
      print("Found page with IO fix issue:")
      print(data)

    last_page = gdb.execute("p $lru_page.LRU.next", to_string=True).endswith("0x0\n")
    while not last_page:
      gdb.execute("set $lru_page=$lru_page.LRU.next", to_string=True)
      io_fix_none = gdb.execute("p $lru_page.io_fix", to_string=True).endswith("BUF_IO_NONE\n")
      if not io_fix_none:
        data = gdb.execute("p $lru_page", to_string=True)
        print("Found page with IO fix issue:")
        print(data)


      last_page = gdb.execute("p $lru_page.LRU.next", to_string=True).endswith("0x0\n")
(gdb) source print_lru_list.py
(gdb) p srv_buf_pool_instances
+p srv_buf_pool_instances
$1294173 = 4
(gdb) printlrulist buf_pool_ptr[0]
+printlrulist buf_pool_ptr[0]
Buffer Pool Instance: (buf_pool_t *) 0x34300d8
Total Pages in LRU:
80882
(gdb) printlrulist buf_pool_ptr[1]
+printlrulist buf_pool_ptr[1]
Buffer Pool Instance: (buf_pool_t *) 0x3430980
Total Pages in LRU:
80883
Found page with IO fix issue:
++p $lru_page
$1941237 = (buf_page_t *) 0x7f26d091db00
(gdb) printlrulist buf_pool_ptr[2]
+printlrulist buf_pool_ptr[2]
Buffer Pool Instance: (buf_pool_t *) 0x3431228
Total Pages in LRU:
80882
(gdb) printlrulist buf_pool_ptr[3]
+printlrulist buf_pool_ptr[3]
Buffer Pool Instance: (buf_pool_t *) 0x3431ad0
Total Pages in LRU:
80883With this, I was able to identify the offending page address causing the issue.
Conclusion
GDB by itself is a powerful tool. Sometimes we need to give it further powers and extend it for our needs. In this article, we explore three different ways of extending and customizing GDB.